Graph
The graph component allows to show statistics data in graph mode.
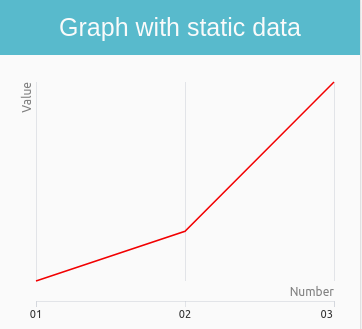
Table of Contents
Default Selectors
Elements with the class="ui-graph" attribute are built as Graph widget.
Changing the value of data-graph="line" applies a variety of graph styles.
Graph's values can be defined static data-value="[1,2,5]" or can be defined by value() method.
HTML Examples
-
To use Graph, you must import
tau.graph.jsalong withtau.js.
To create a graph using the<ui-graph>element:<div class="ui-graph" data-graph="line" data-value="[1,2,5]" data-mode="continuous" data-color="#FF0000" data-xlabel="Number" data-ylabel="Value" data-xinit="0" data-yinit="0" data-axis-x-type="index" data-axis-x-max-count="10" data-axis-x-unit="s" </div>
Options
The options for a component can be defined as data-* attributes or passed as parameters to the constructor.
You can change an option for the component using the option method.
Summary
| Option | Input type | Default value | Description |
|---|---|---|---|
| data-graph | string | null | "line" | Visible style of graph. Supported options: "line", "bar" |
| data-value | string | null | null | Initial values of Graph widget |
| data-mode | string | null | "intermittent" | This option determines how the new values will replaced values of Graph widget. This option allows also value "continuous" which determine that new values will be appended to Graph |
| data-color | string | null | "#0097D8" | This option determines color of line or bar which represents data |
| data-xlabel | string | null | "Number" | Label of X axis |
| data-ylabel | string | null | "Values" | Label of Y axis |
| data-xinit | string | null | "0" | Initial value of Graph on X axis |
| data-yinit | string | null | "0" | Initial value of Graph on Y axis |
| data-axis-x-type | string | null | "time" | Defines type of values on X axis. Supported values: "time", "index" |
| data-axis-x-max-count | number | null | null | Max number of data showing in serie |
| data-axis-x-unit | string | null | null | The unit name for x axis values |
Methods
To call a method on the component, use one of the existing APIs:
<script type="text/javascript" src="lib/tau/libs/tau.graph.js"></script>
<script type="text/javascript" src="lib/tau/libs/tau.js"></script>

<script>
    var graphElement = document.getElementsByClassName("ui-graph"),
        graph = tau.widget.Graph(graphElement);

    graph.value([1,4,3,5]);
</script>
Summary
| Method | Description |
|---|---|
string value(string? value) |
Gets or sets a value. |
value-
Gets or sets a value.
object value(number? value)
Since: 5.5
The method returns the Graph values as object
Parameters:
Parameter Type Required/optional Default value Description value number | array | null Optional null Widget accepts data series as array, eg. [1,2,4,5,8]
when Graph has attributeoption-mode="continuous"is set then widget accept single value to append to graph.Return value:
Type Description string In the get mode, returns value as object. Code example:
<script type="text/javascript" src="lib/tau/libs/tau.graph.js"></script>
<script type="text/javascript" src="lib/tau/libs/tau.js"></script>

<div class="ui-graph"></div>
<script>
    var element = document.getElementsByClassName("ui-graph"),
        graphWidget = tau.widget.Graph(element, {
			mode: "continuous",
			graph: "line",
			color: "#FF0000",
			xlabel: "Number",
			ylabel: "Value",
			xinit: 0,
			yinit: 0,
			axisXType: "time",
			axisXUnit: "s"
		}),

    graphWidget.value(5);
</script>