Get Started with Memory Profiling
Run Memory Profiler
-
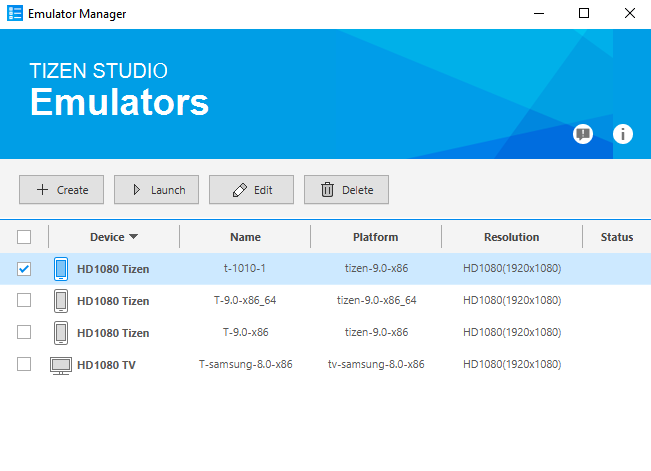
If no Tizen device is connected and no Tizen emulators are running then launch Emulator Manager and launch the type of emulator you want to use for running and profiling your application.
-
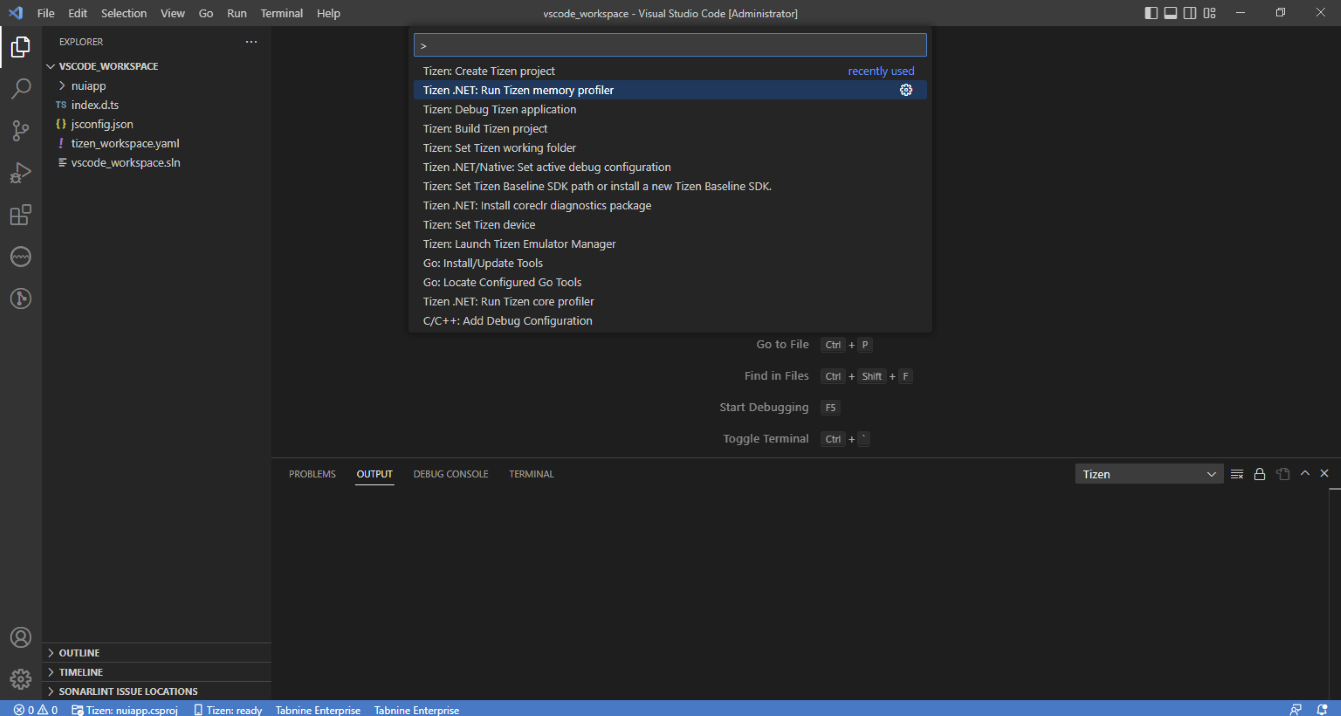
Open the Command Palette and select Tizen.NET: Run Tizen memory profiler.
-
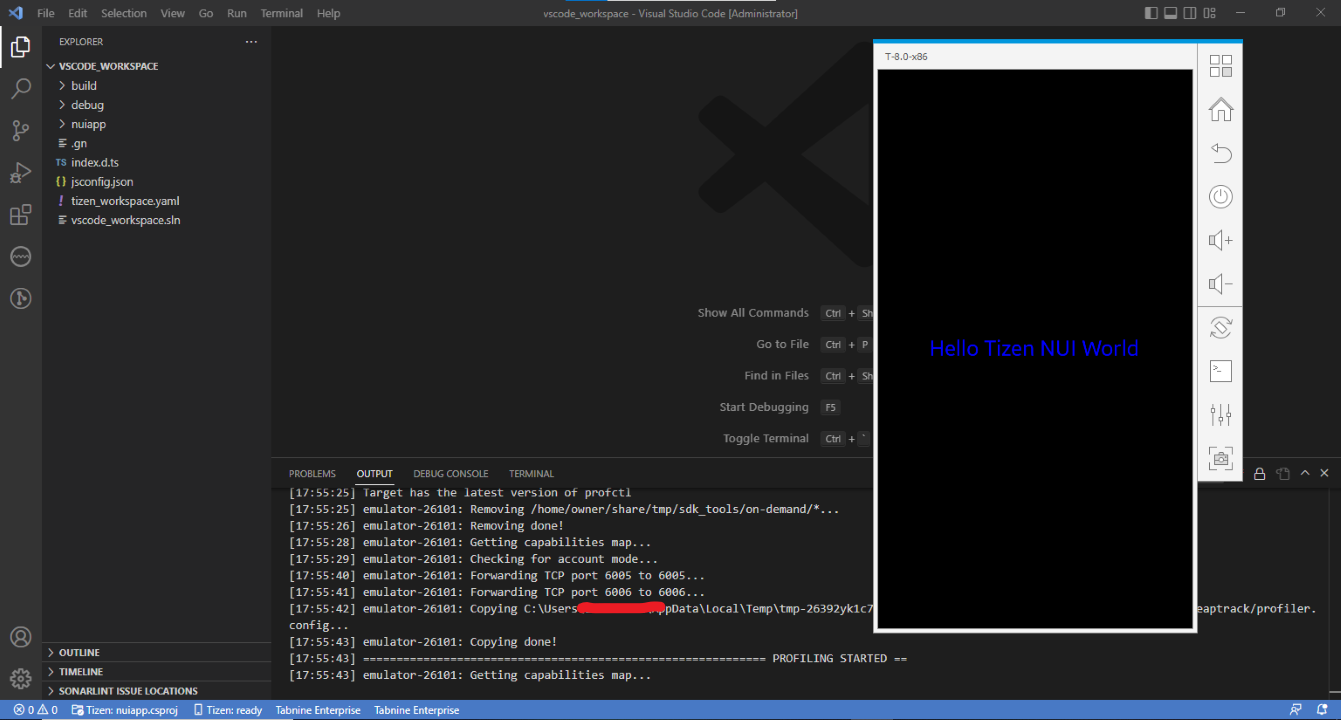
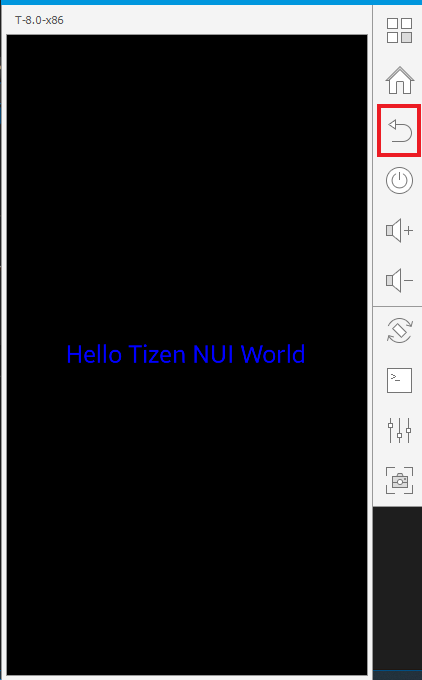
If everything is ok then the application starts as if you are running it normally.
-
The memory profiling data will be displayed with the Memory Profiler GUI after closing the application. The application can be closed by pressing the “Back” button.
Analyze the results
-
The GUI application provides several views of the memory profiling data. The views include the following:
- Summary page with information on which process was profiled, its total runtime, some memory related statistics, and so on.
- Bottom-up table tree view of the code locations that allocated memory with their aggregated cost and stack traces.
- Caller/Callee table.
- Top-down table tree view of the code locations.
- Managed heap table tree view.
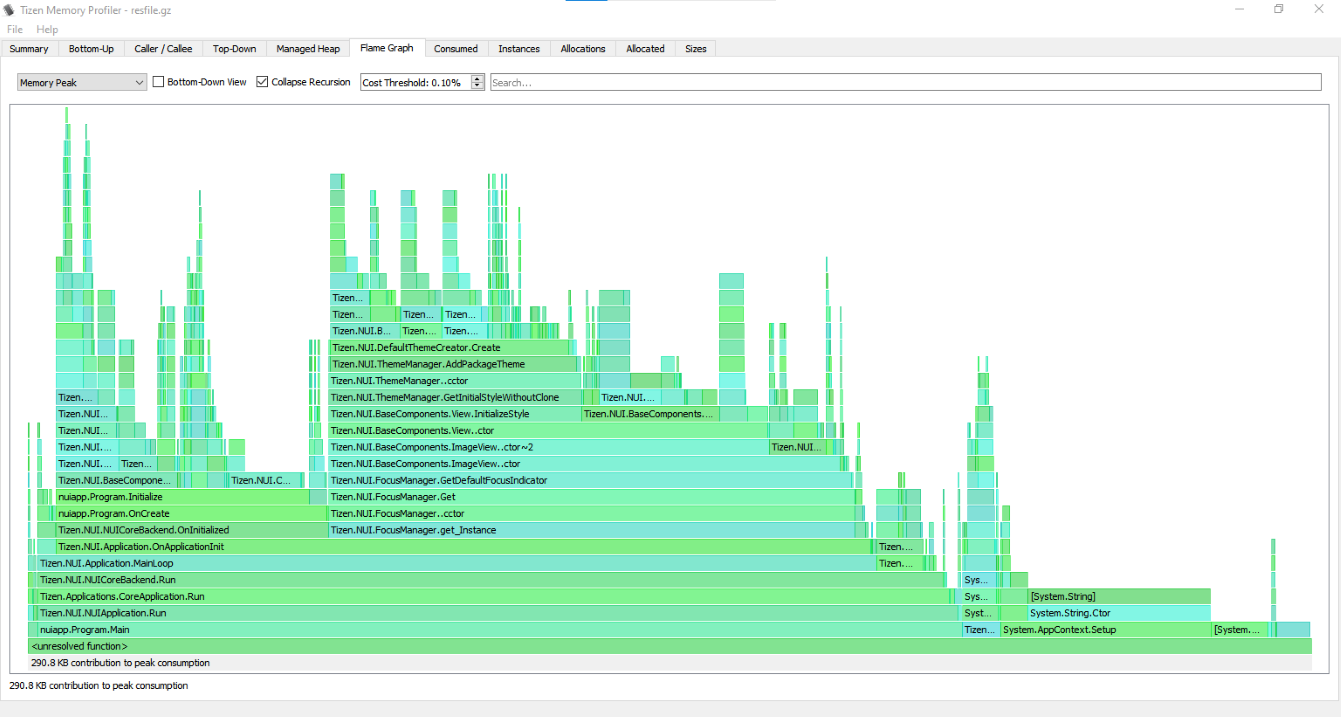
- Flame graph visualization (explanation: http://www.brendangregg.com/FlameGraphs/memoryflamegraphs.html).
- Consumed memory size over time graph.
- Number of instances over time graph.
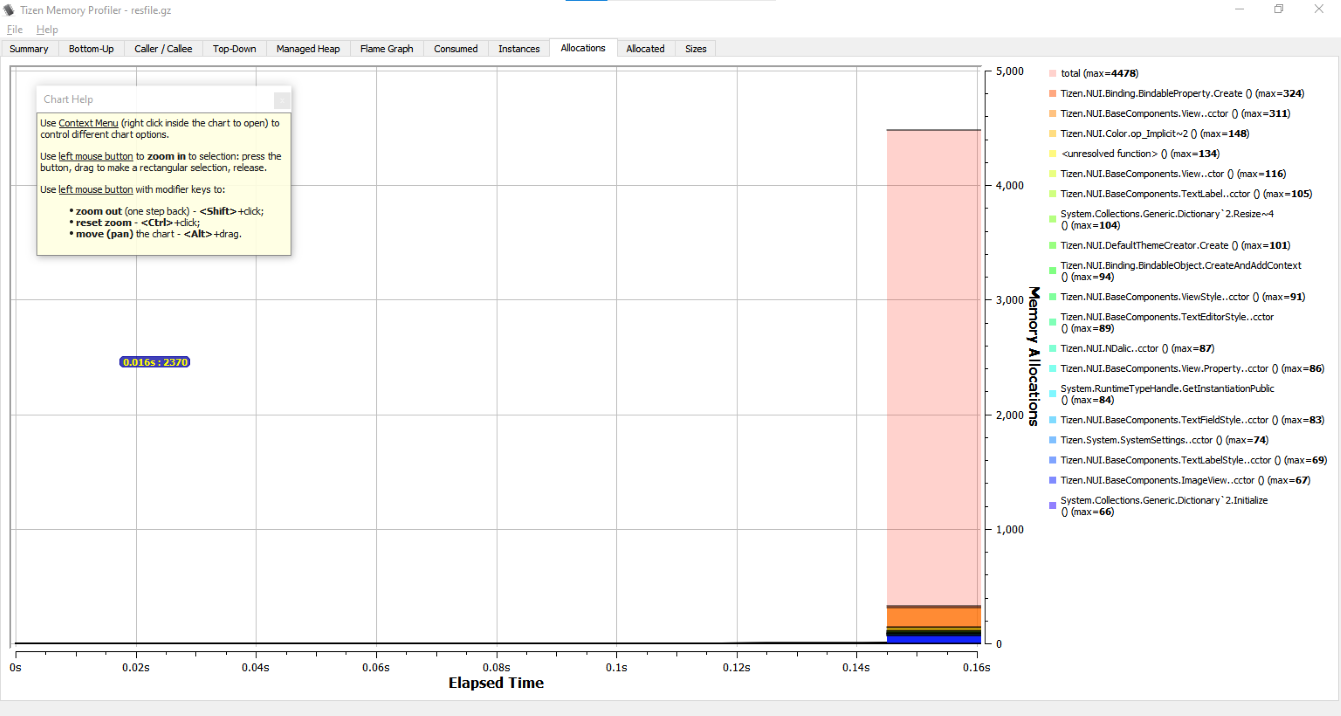
- Number of memory allocations over time graph.
- Size of memory allocated over time graph.
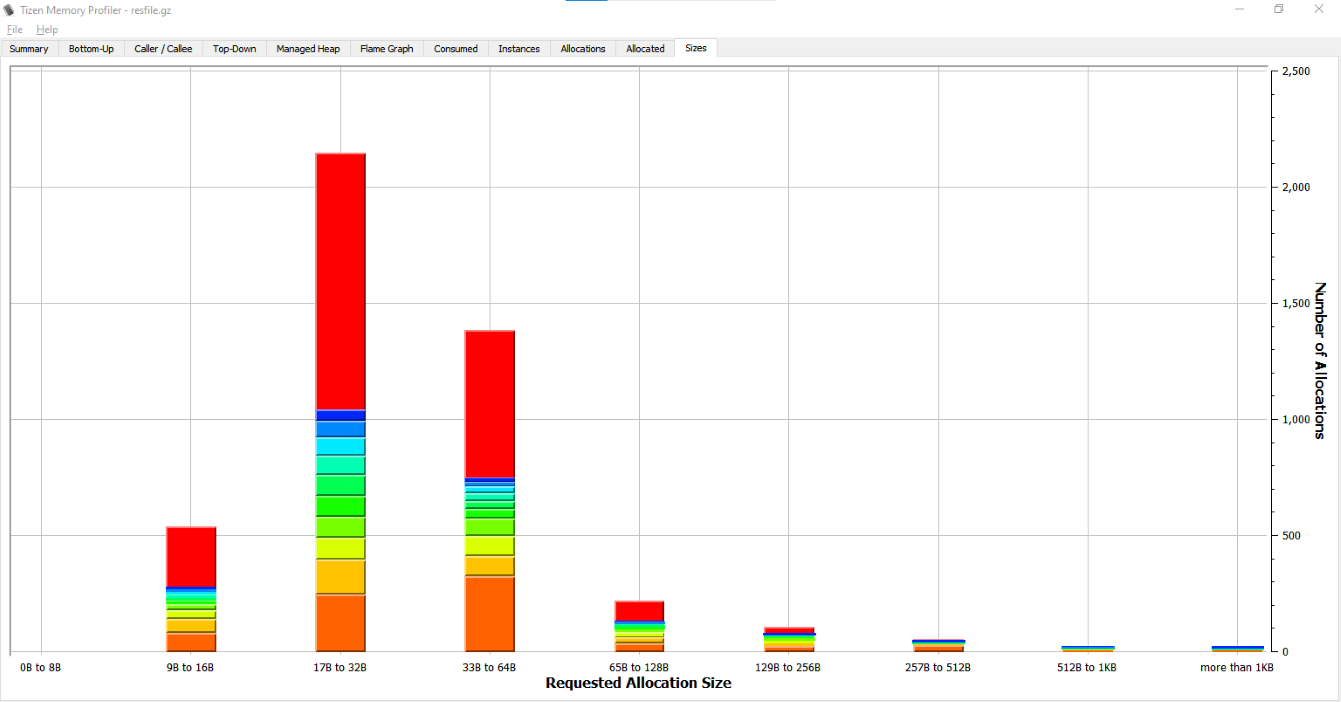
- Allocation histogram displaying the number of allocations (the total number and the several topmost code locations) belonging to one of the groups divided by allocation size (0 - 8 bytes, 9 - 16 bytes, … , 512 bytes - 1 KB, more than 1 KB).
Flame graph view sample
Memory allocations graph view sample
Allocation histogram view sample