Get Started with .NET Core Diagnostics
.NET Core Diagnostics supports a number of tools that can be used to diagnose the Tizen .NET applications. It includes dotnet-gcdump, dotnet-dump, and dotnet-trace tools to aid .NET developers in diagnosing their applications.
Prerequisites
Below are the prerequisites for using Tizen .NET Core Diagnostics in Visual Studio:
- Make sure that Tizen Studio Version 5.5 or above is installed.
- Make sure to set the Tool Path (Tizen SDK) in Tools > Options > Tizen > Tools with the installed 5.5 or above Tizen Studio path.
Tizen .NET Core Diagnostics tools
dotnet-gcdump
Step 1. Run dotnet-gcdump tool
-
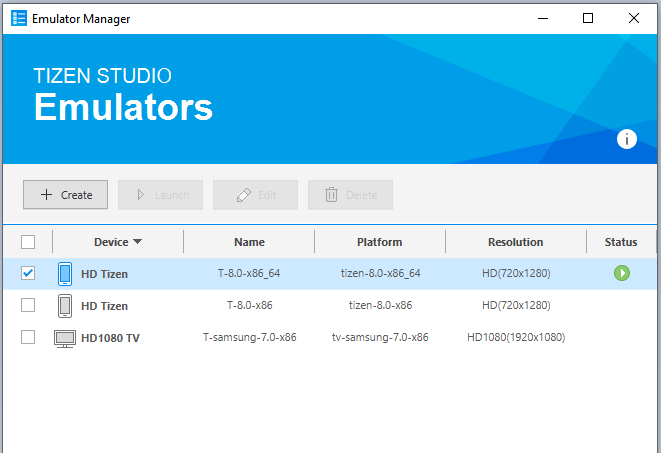
If no Tizen device is connected and no Tizen emulators are running then launch the type of emulator you want to use for diagnosing your application.
-
In the menu, choose Tools > Tizen > .NET Core Diagnostics > dotnet-gcdump.
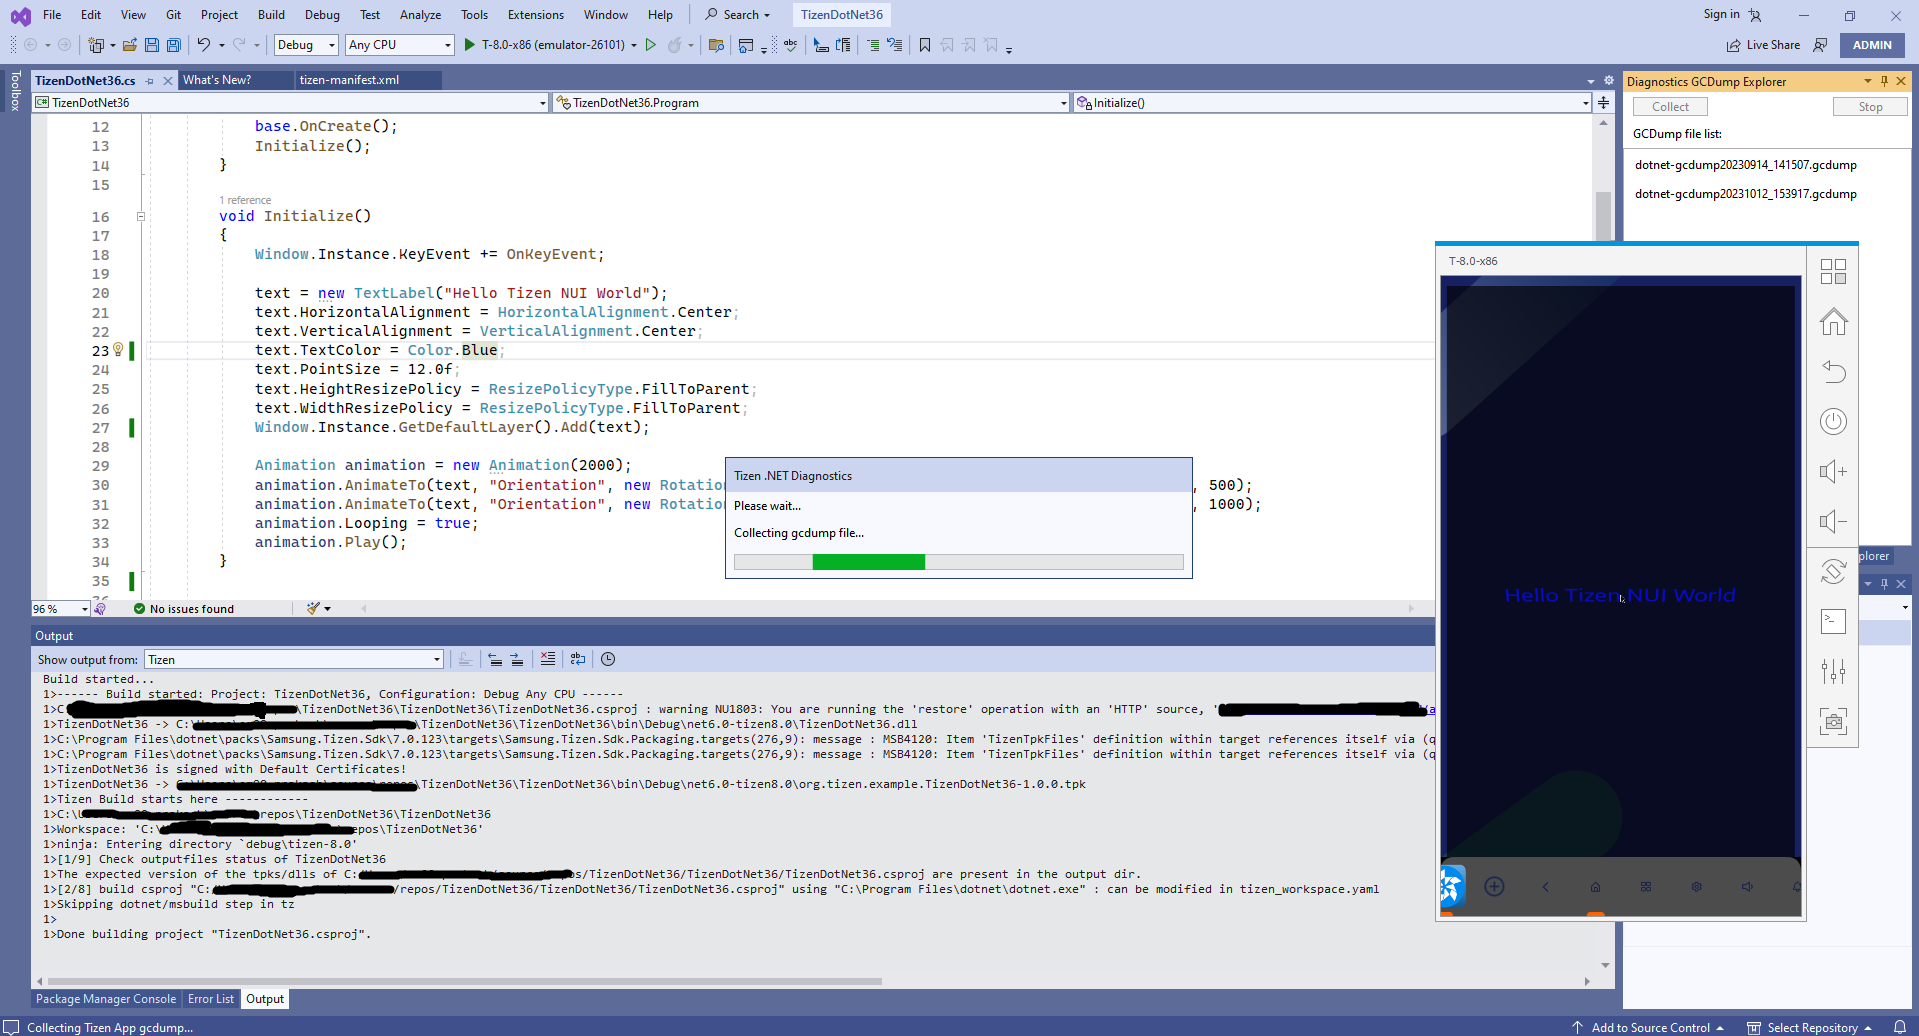
Now click the Collect button provided in Diagnostics GCDump Explorer window.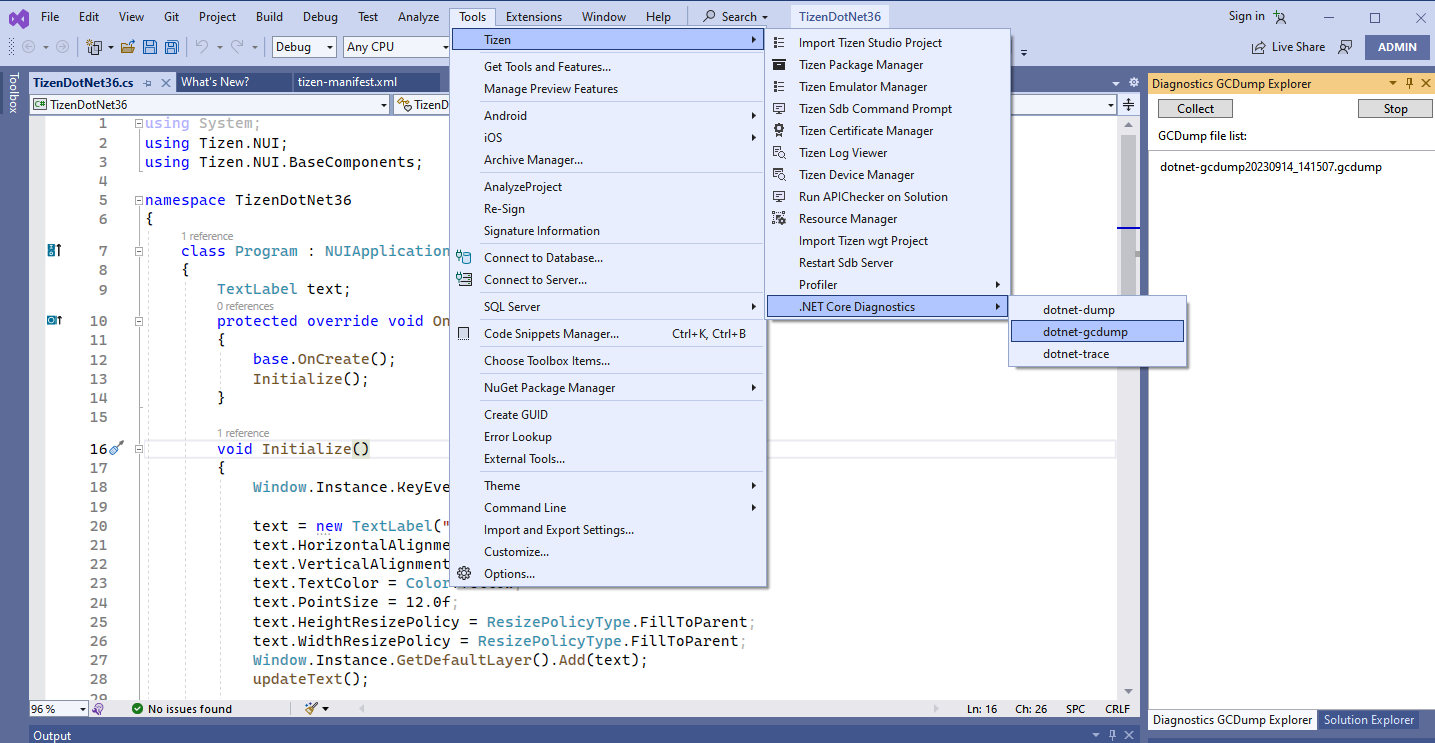
-
If everything is ok then the application starts and it starts collecting the gcdump file.
-
Once the gcdump file is collected, a message popup is shown to inform the user, and the file is added to the gcdump file list in GCDump Explorer window.
-
User can collect the gcdump file multiple times by clicking the Collect button, until the application is closed by pressing “Home” or “Back” buttons, or by clicking the Stop button given in GCDump Explorer window.
Step 2. Analyze the gcdump file
-
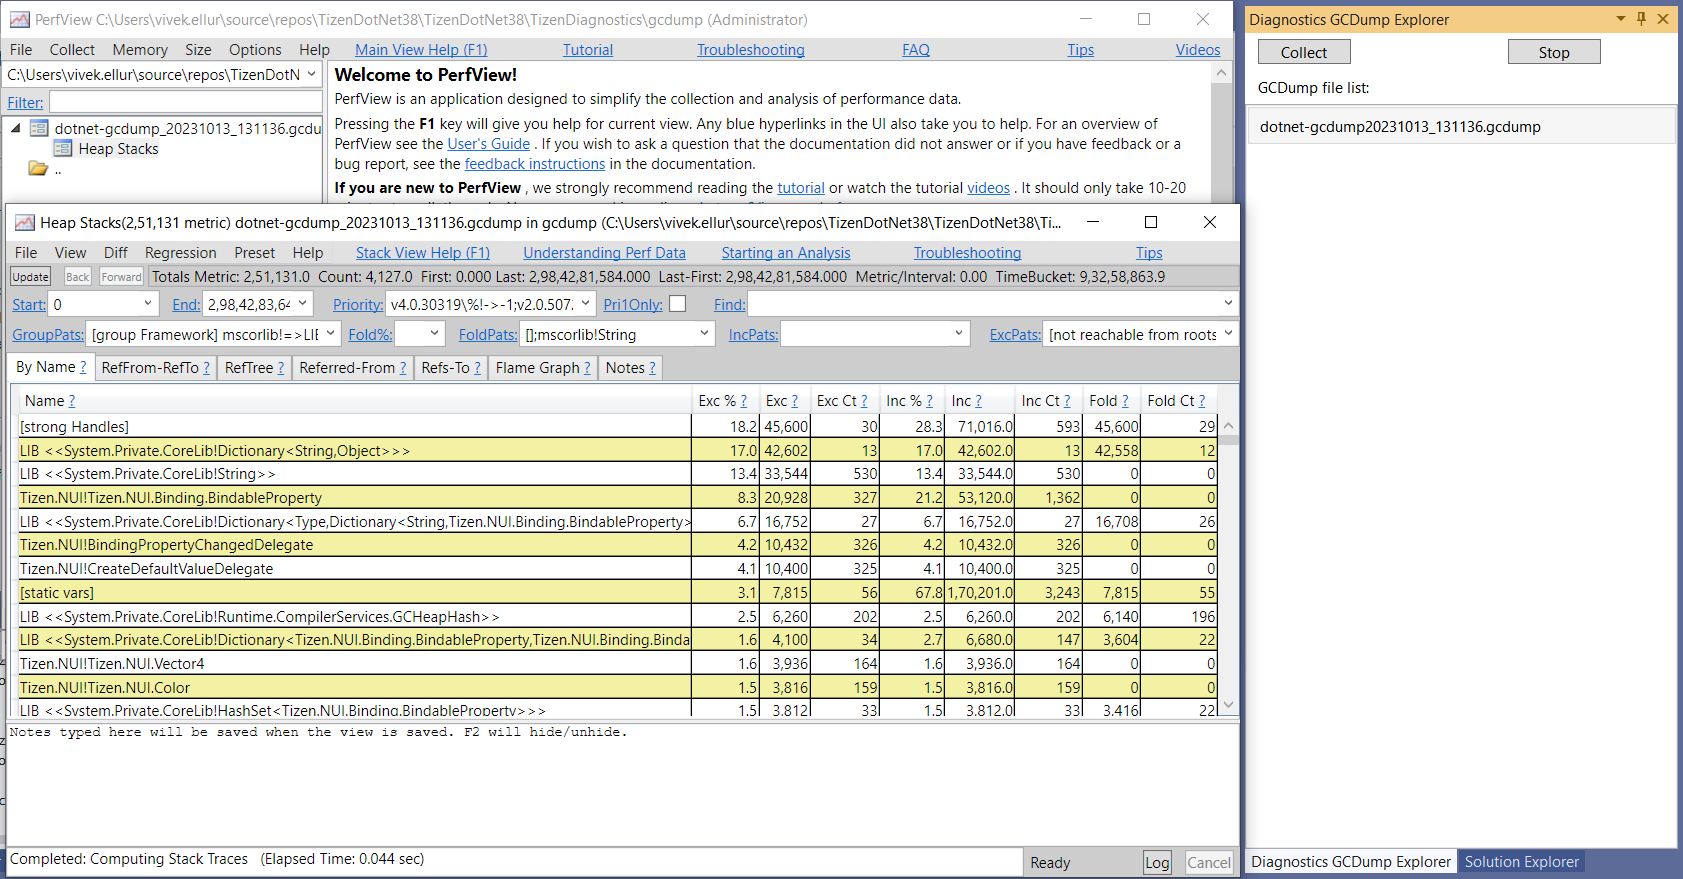
The GUI application provides two tools to view the gcdump diagnostics data. The views include:
- Double click the gcdump file in GCDump Explorer window. It will open the file in PerfView tool.
- Right click the gcdump file in GCDump Explorer window and select Open With Editor. It will open the file in Visual Studio.
- Double click the gcdump file in GCDump Explorer window. It will open the file in PerfView tool.
dotnet-trace
Step 1. Run dotnet-trace tool
-
If no Tizen device is connected and no Tizen emulators are running then launch the type of emulator you want to use for diagnosing your application.
-
In the menu, choose Tools > Tizen > .NET Core Diagnostics > dotnet-trace.
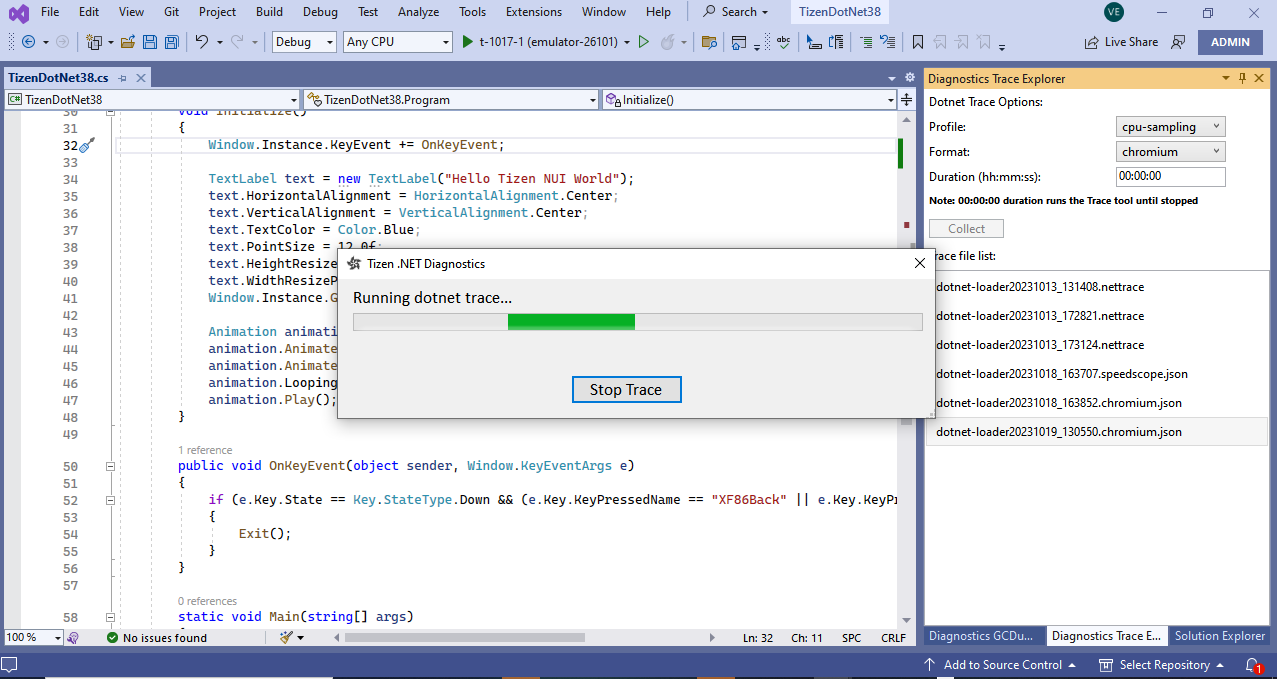
Now select the trace Profile, Format and Duration options and click the Collect button provided in Diagnostics Trace Explorer window.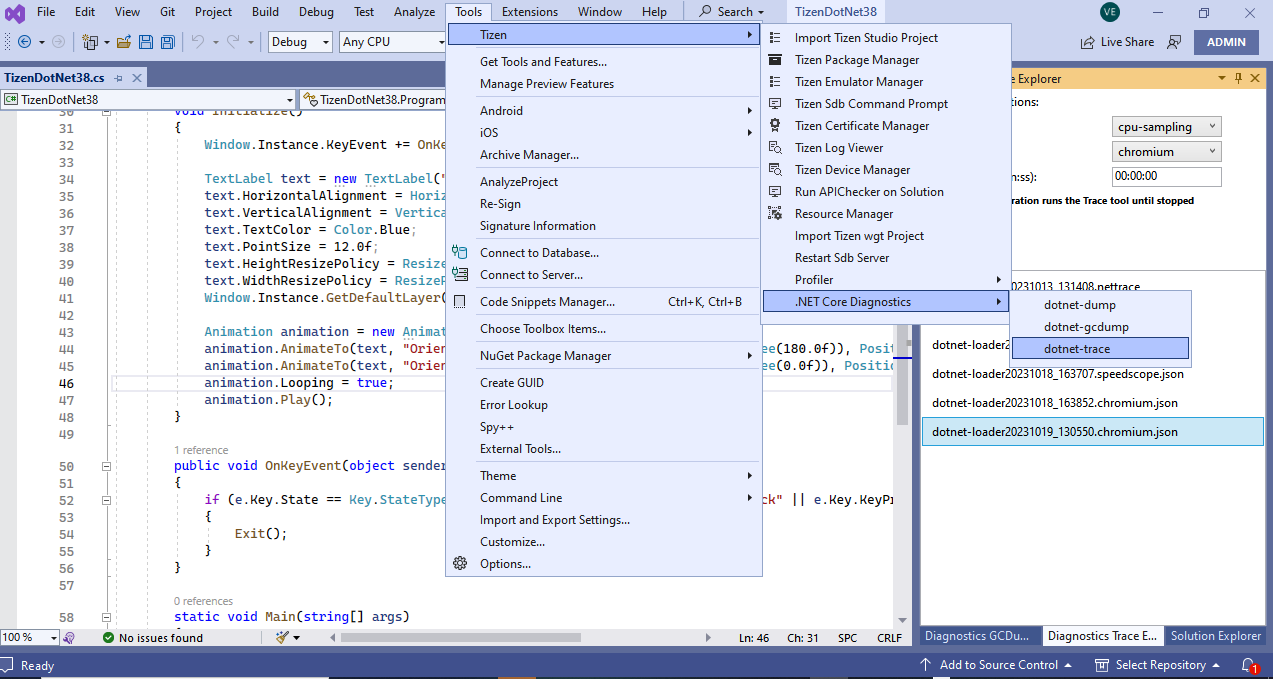
-
If everything is ok then the application starts and it starts collecting the trace.
- If application is not already running in the device/emulator then trace will be collected from application startup.
- If application is already running in the device/emulator then trace will be collected from there on.
-
Press Stop Trace button above to stop and generate the trace file.
-
Once the trace file is generated, a message popup is shown to inform the user, and the file is added to the gcdump file list in Dump Explorer window.
Step 2. Analyze the trace file
- The GUI application provides different tools for different Format to view the trace diagnostics data.
- nettrace
- Double click the trace (.nettrace) file in Trace Explorer window. It will open the file in PerfView tool.
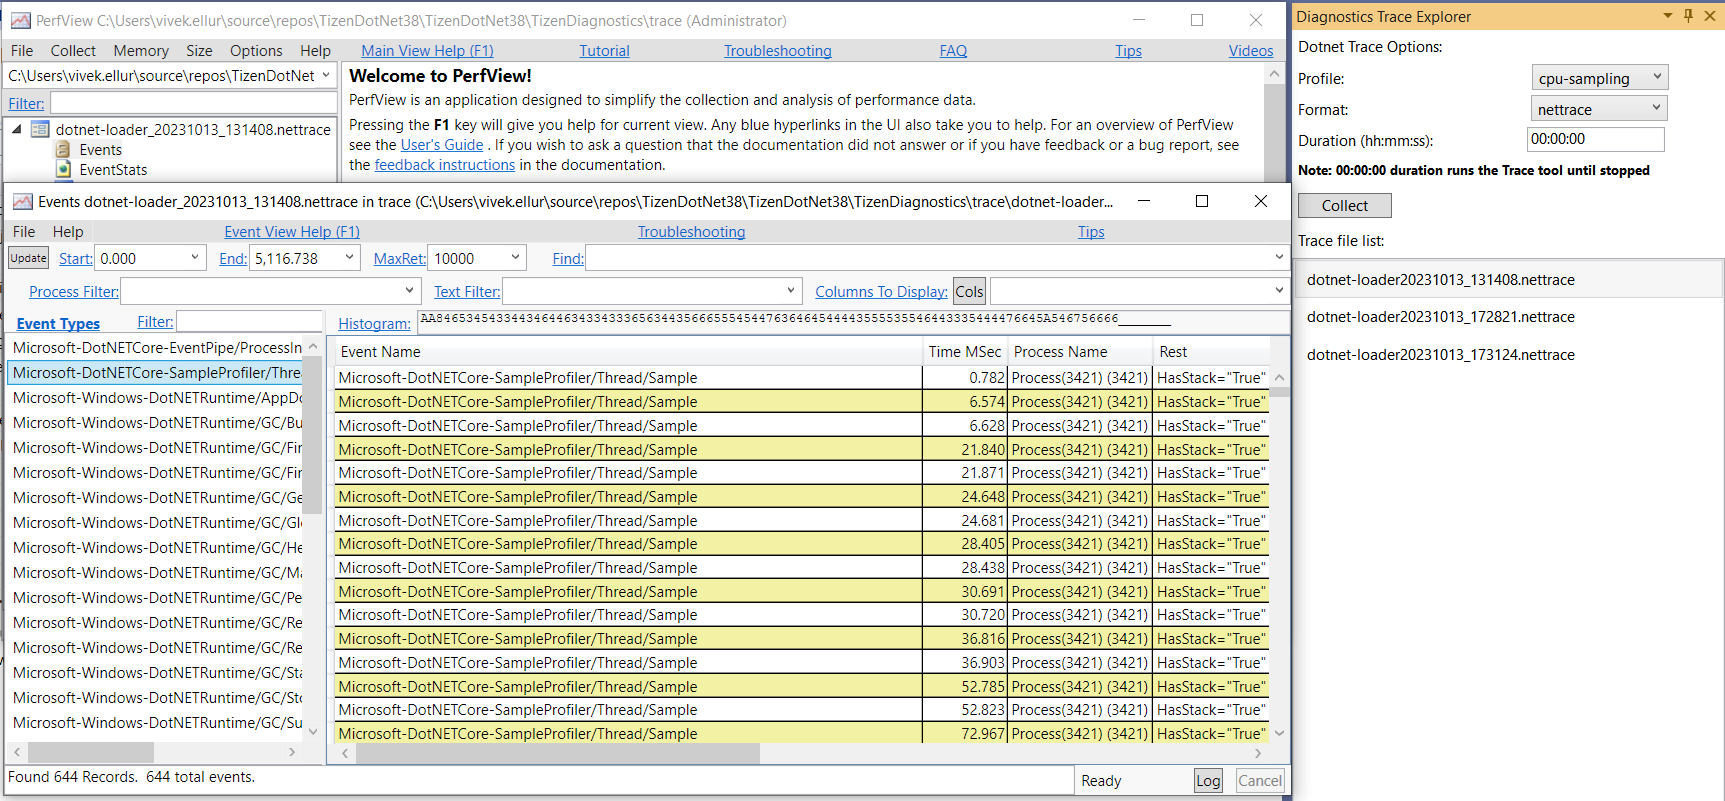
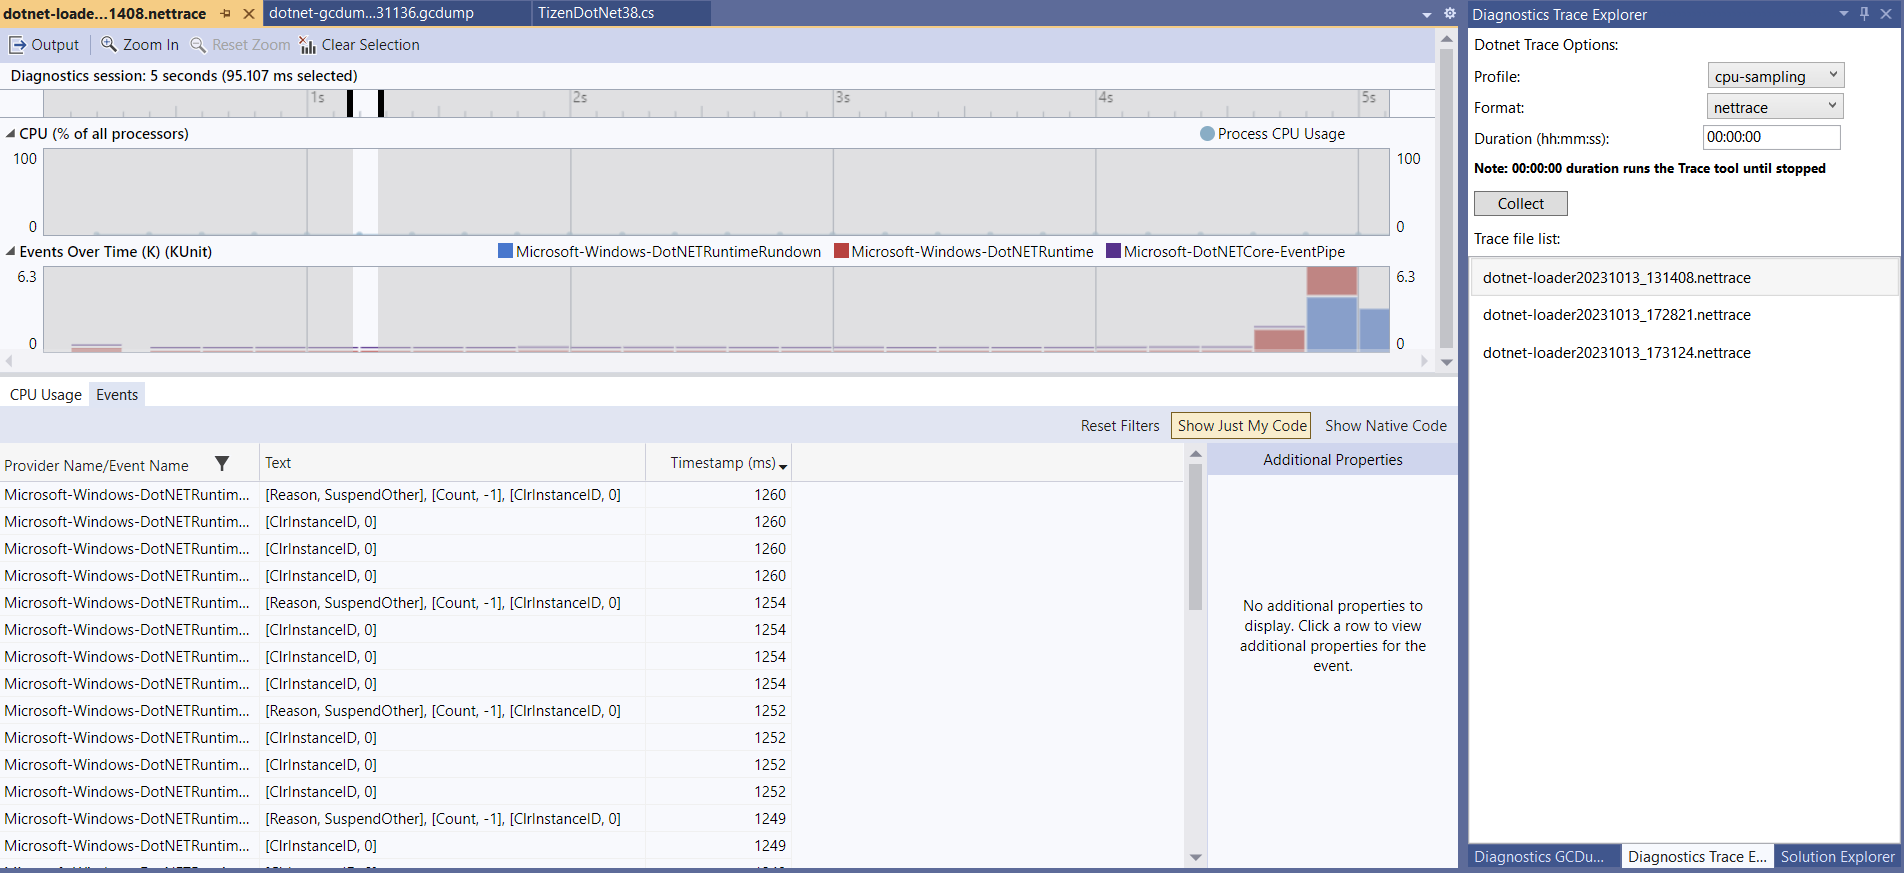
- Right click the trace file in Trace Explorer window and select Open With Editor. It will open the file in Visual Studio.
- Double click the trace (.nettrace) file in Trace Explorer window. It will open the file in PerfView tool.
- speedscope
- Double click the trace (.speedscope.json) file in Trace Explorer window. It will open the file in speedscope web tool.
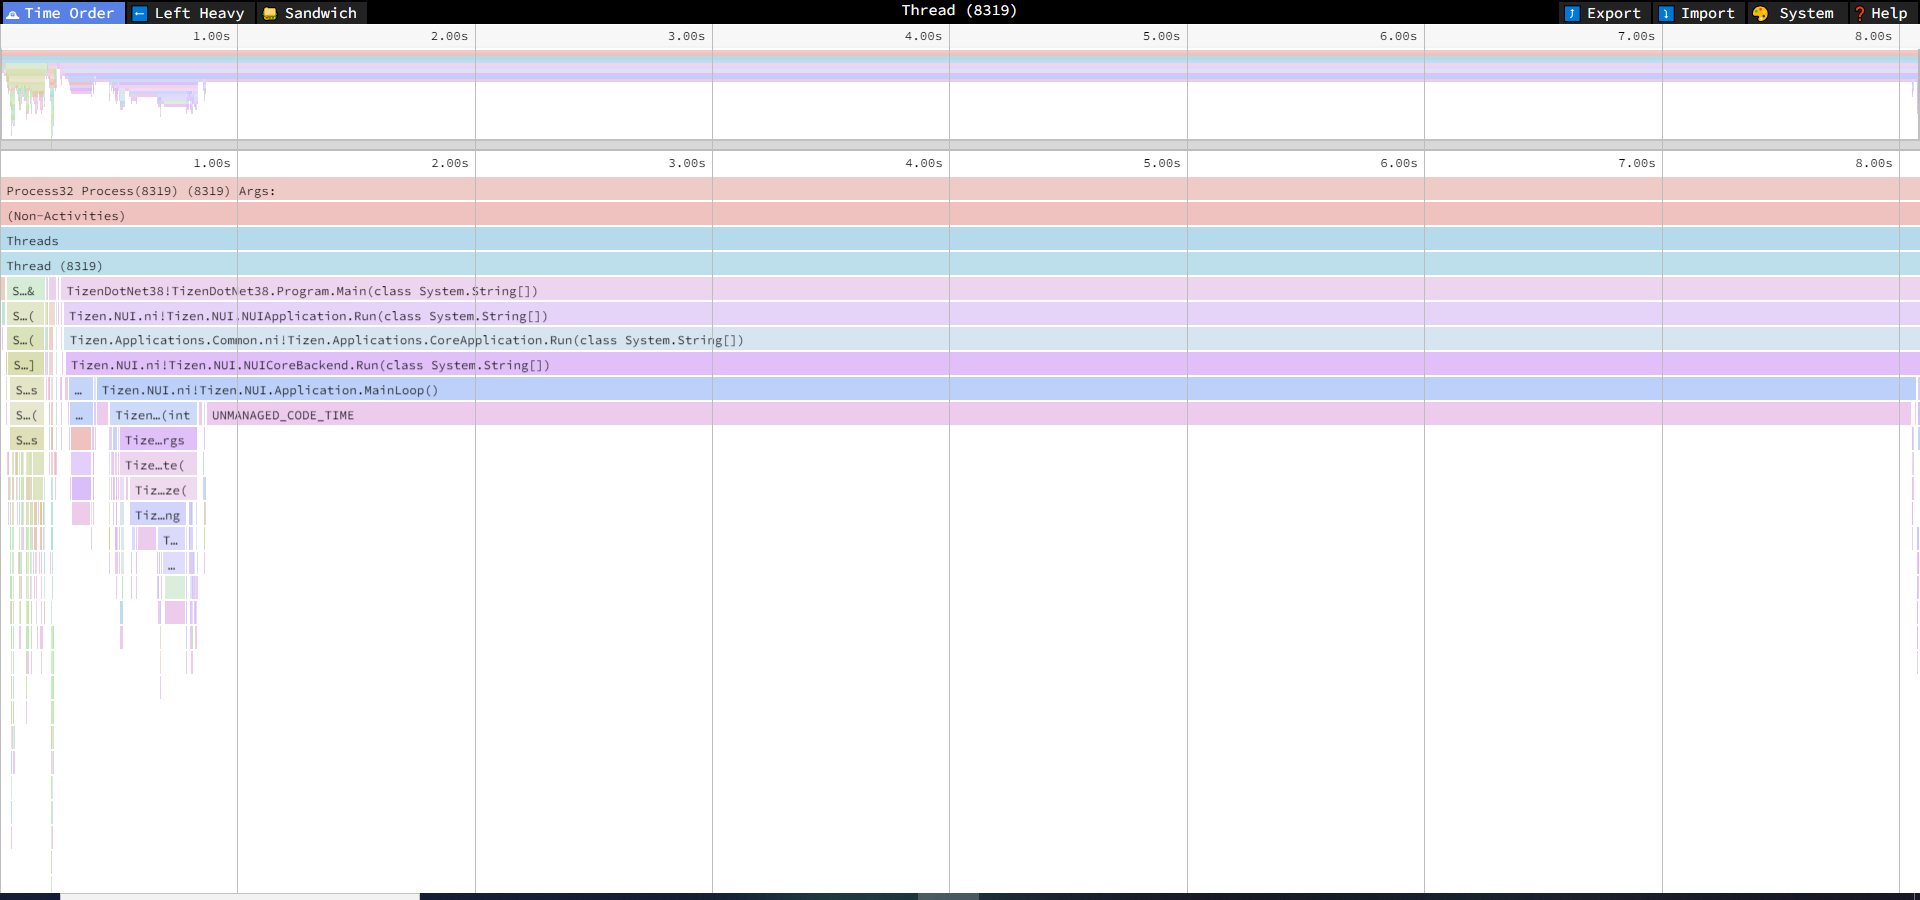
- Double click the trace (.speedscope.json) file in Trace Explorer window. It will open the file in speedscope web tool.
- chromium
Open Google Chrome and type chrome://tracing or Microsoft Edge browser and type edge://tracing.
Now click on Load button which fill open file explorer and select the .chromium file and click Open.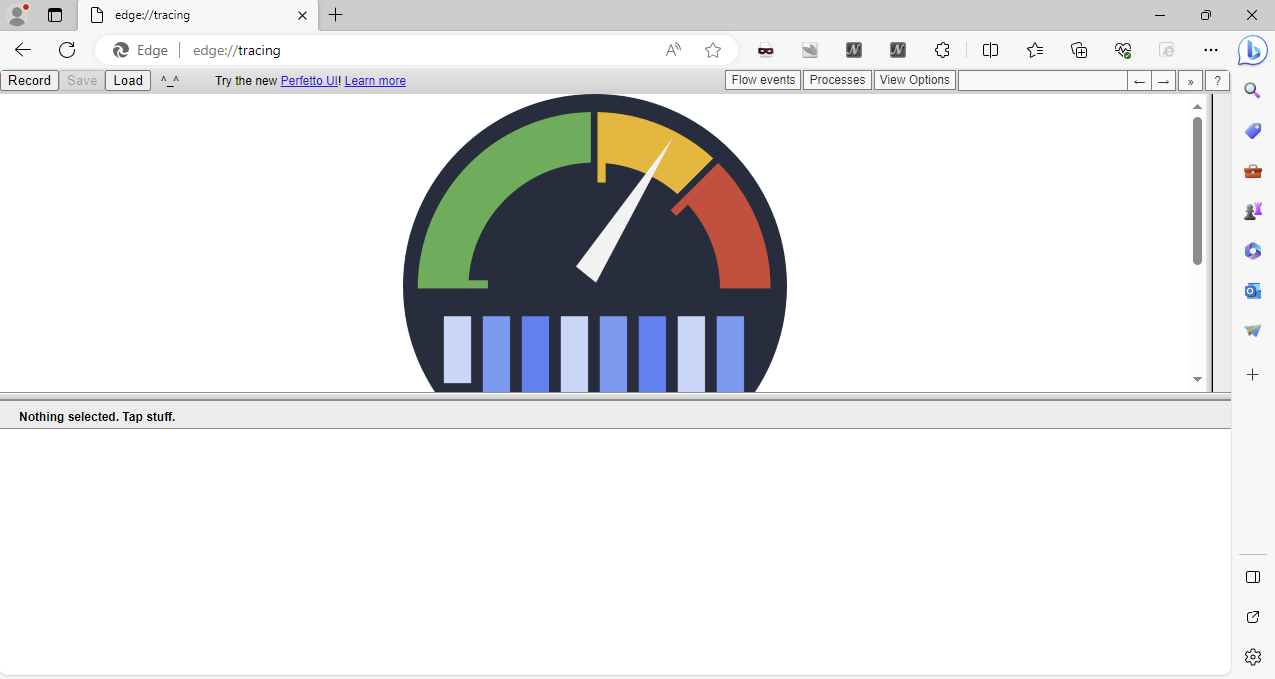
dotnet-dump
Step 1. Run dotnet-dump tool
-
If no Tizen device is connected and no Tizen emulators are running then launch the type of emulator you want to use for diagnosing your application.
-
In the menu, choose Tools > Tizen > .NET Core Diagnostics > dotnet-dump.
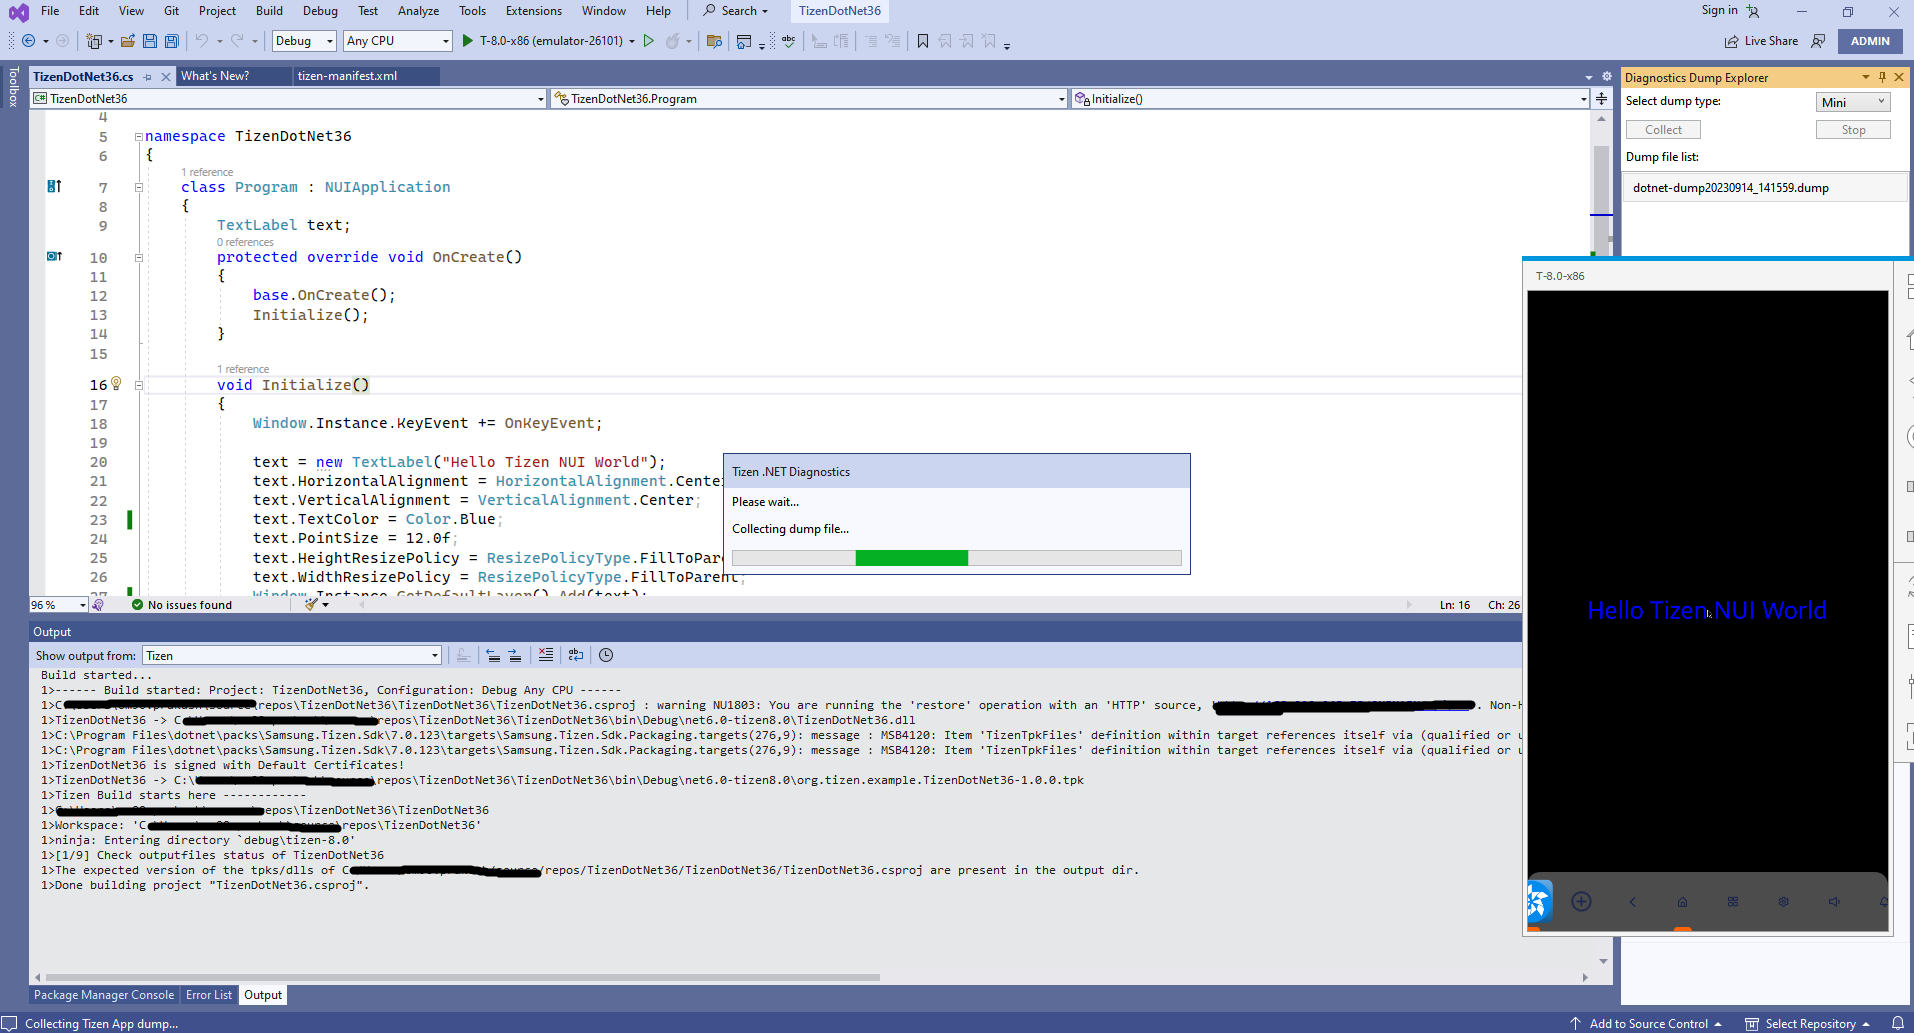
Now select the dump type from drop down list and click the Collect button provided in Diagnostics Dump Explorer window.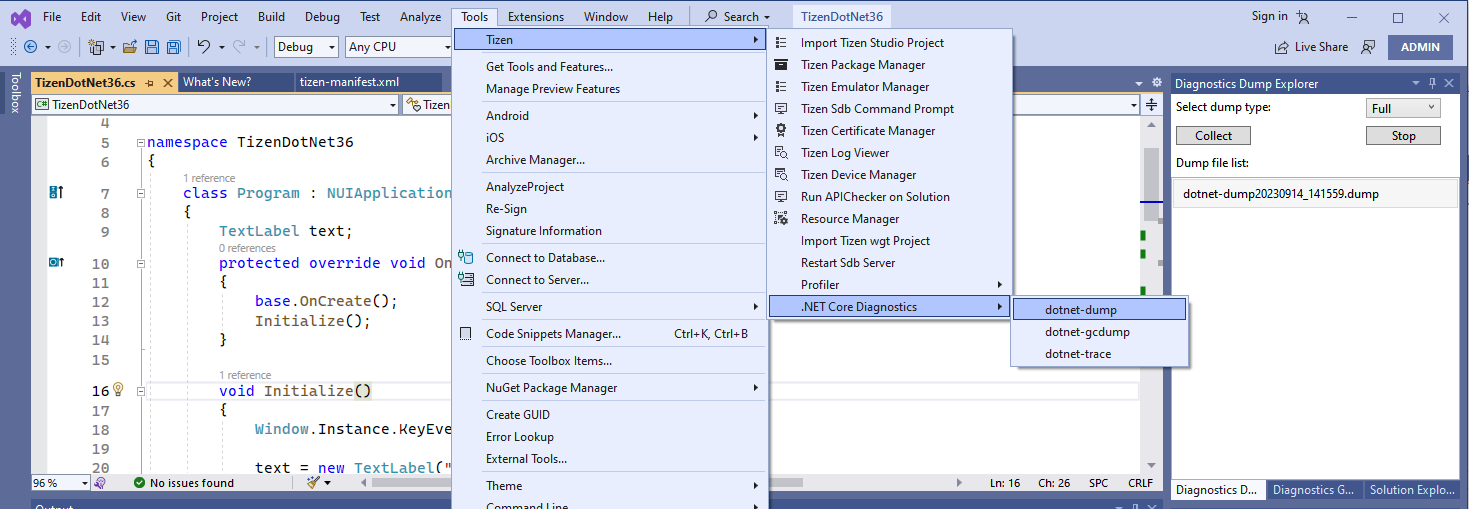
-
If everything is ok then the application starts and it starts collecting the dump file.
-
Once the dump file is collected, a message popup is shown to inform the user, and the file is added to the gcdump file list in Dump Explorer window.
-
User can collect the dump file multiple times by clicking the Collect button, until the application is closed by pressing “Home” or “Back” buttons, or by clicking Stop button given in Dump Explorer window.
Step 2. Analyze the dump file
- Open the sdb shell
- Go to the folder (/home/owner/share/tmp/sdk_tools) containing the dump file
- Run the command dotnet dump analyze {file_name}
Note: Please delete the dump file after analyze as it takes lot of memory space.