Get Started with Performance Profiling
Running Core Profiler
-
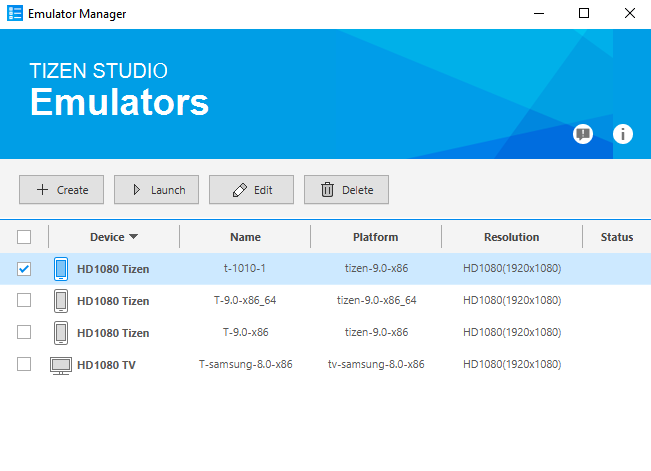
If no Tizen device is connected and no Tizen emulators are running then launch Emulator Manager and launch the type of emulator you want to use for running and profiling your application.
-
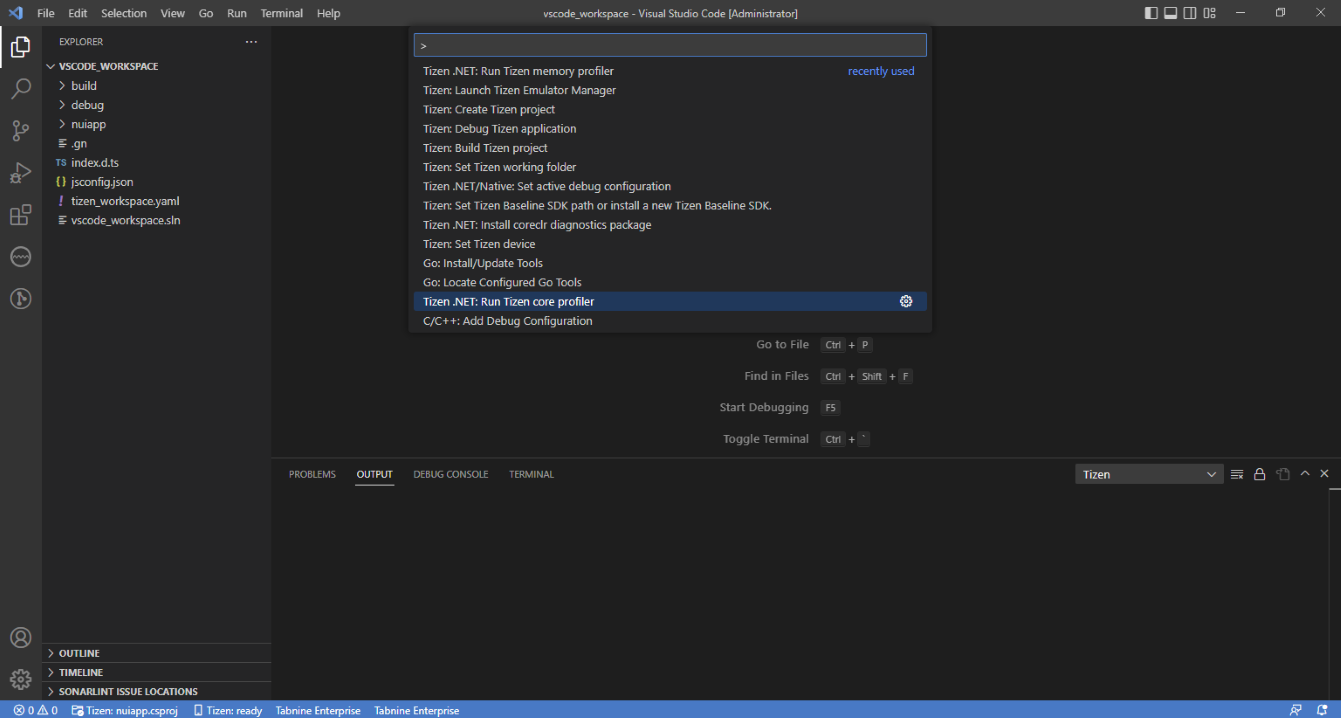
Open the Command Palette and select Tizen.NET: Run Tizen core profiler.
-
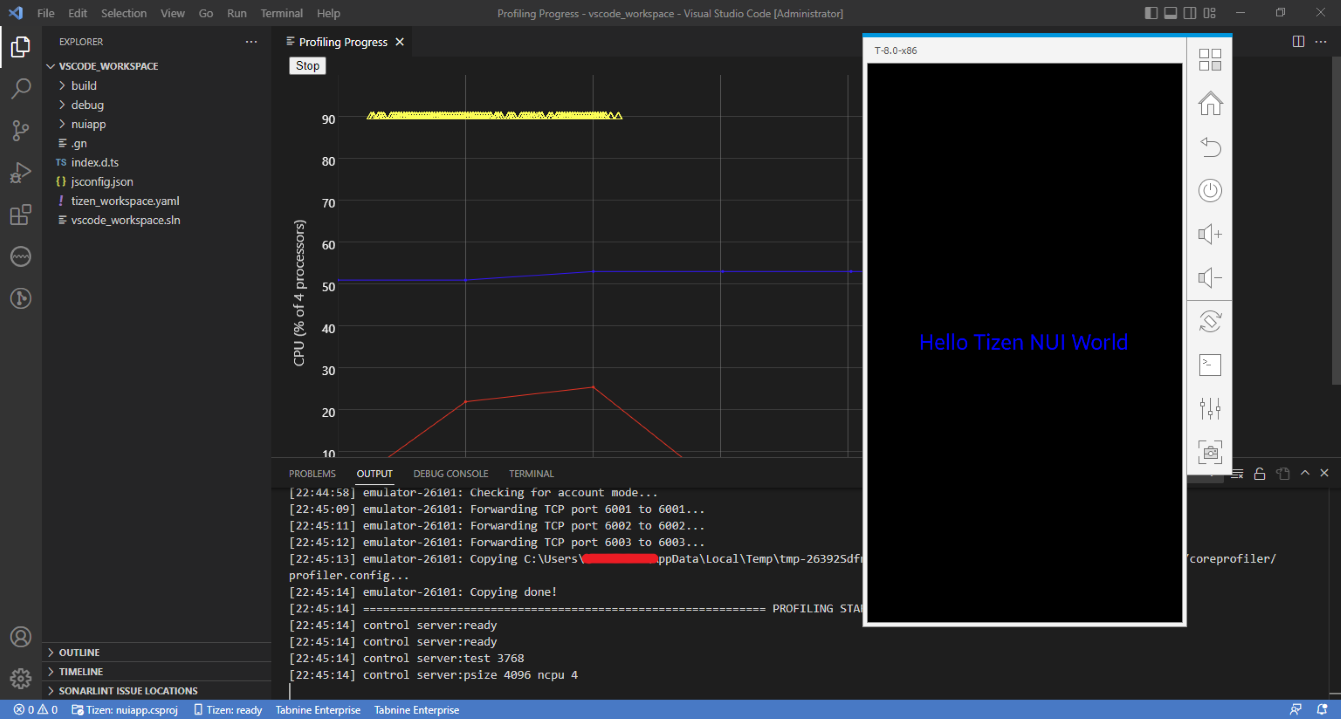
If everything is ok then the application starts as if you are running it normally.
-
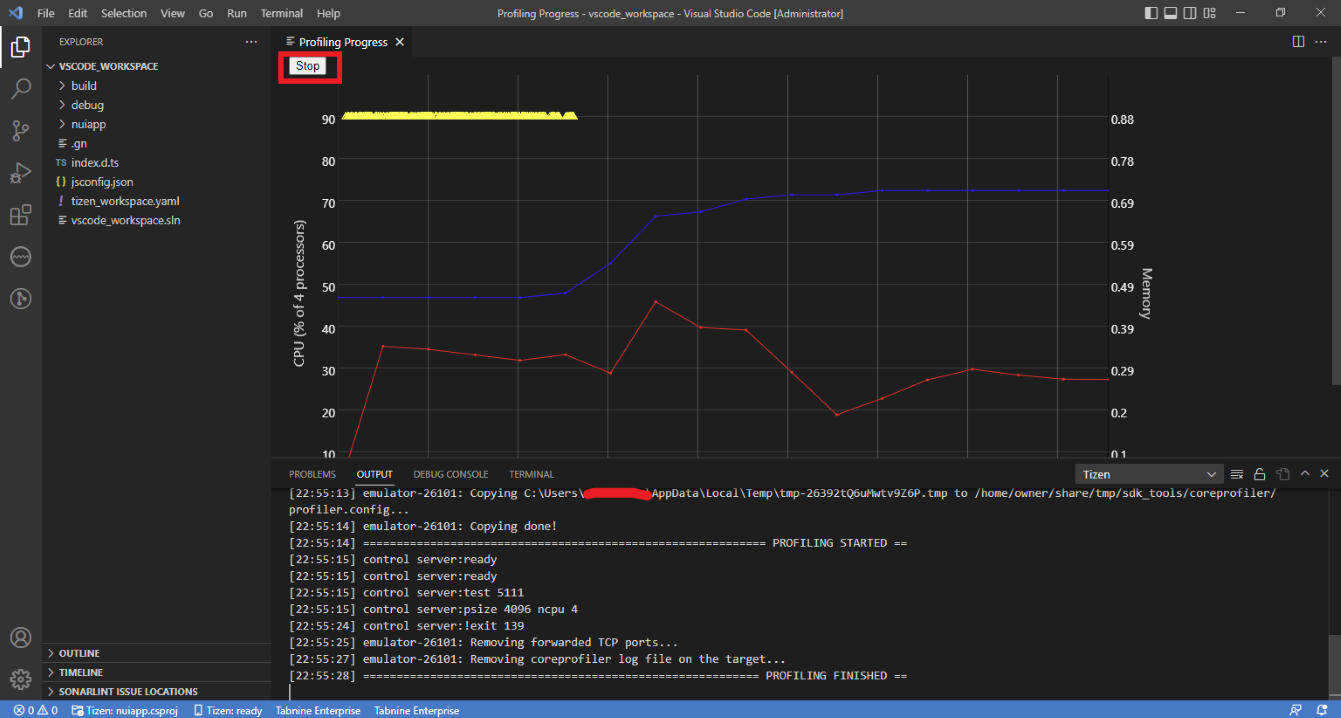
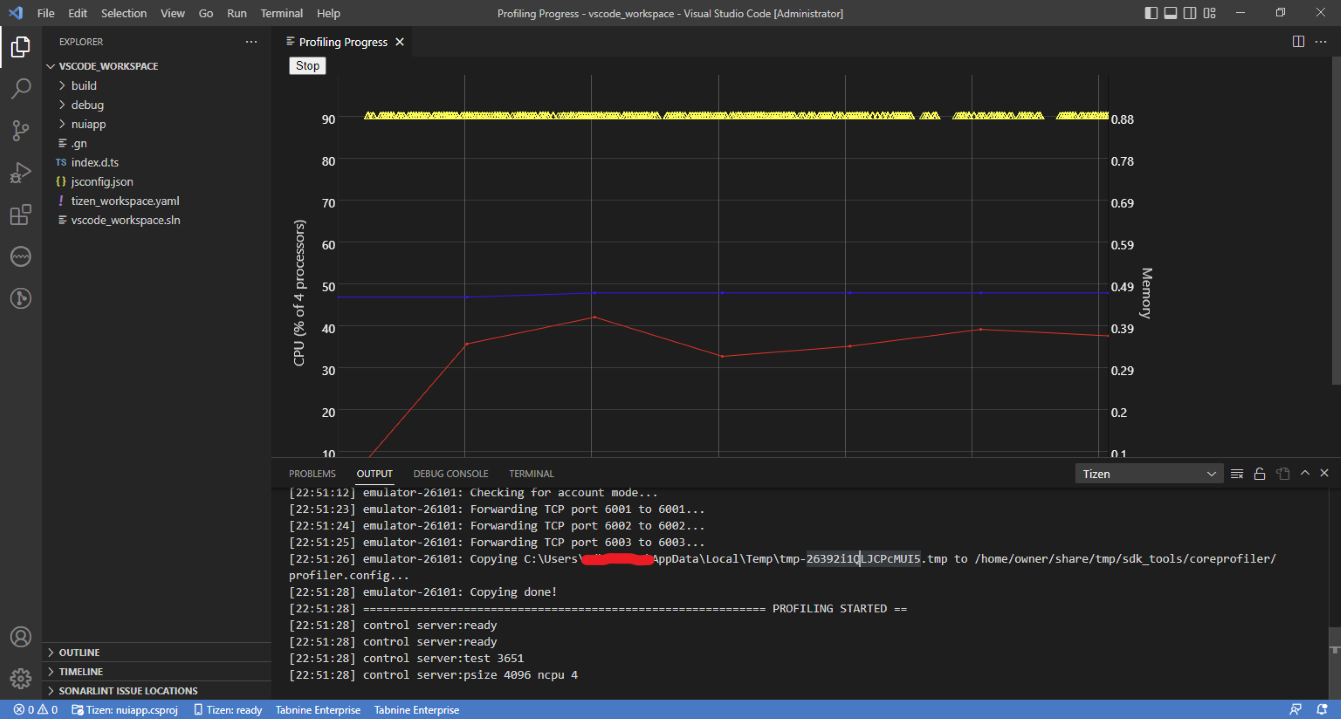
Profiling progress window will be displayed with a “Stop” button in a new tab showing the application’s live performance profiling.
-
Profiling can be stopped by clicking the “Stop” button.